
Closetronic: Sales Dashboards w/ Close.io & Leftronic
At Krossover, we believe in full transparency when it comes to the sales team. To put this belief into action, we wanted to take high-level sales activities such as calls made, pipeline created, revenue made, & week-over-week growth and display it for the entire office to see.
With new sales data being generated every minute, we needed a way to display this information to the whole team without having to update anything manually. The dashboards had to look pretty too. After tinkering with a few dashboards-as-a-service platforms, we picked Leftronic because their push API is simple to use and already having a Python package didn’t hurt either.
Then we just needed to push data to Leftronic.
We use Close.io as our CRM. Our sales culture and process depends heavily on calling prospects and customers, and Close.io fully integrates VoiP phone calls. It’s a great fit for us, especially because all of your data is easily accessible via their API. I highly recommend Close.io for any B2B startup that wants to get serious about sales outreach (more on this later).
Here’s how we made our awesome live sales dashboards using Leftronic, Close.io, and a simple python script.
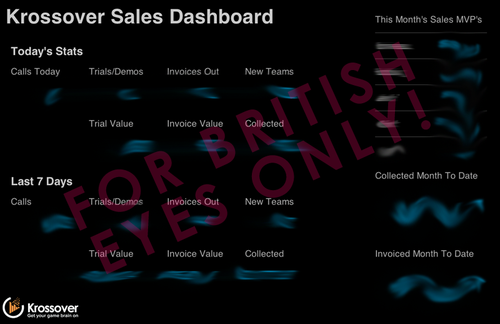
The Krossover Sales Dashboard
Here’s a peek at one of the sales dashboards we have up in our office:
From Close.io To Leftronic
The neat thing about Close.io is that you can get almost any reporting or search query page to generate a JSON response.
As an example, here’s how easy it is get the amount of calls your whole team made today and post it to a Leftronic widget on a dashboard:
import requests, json
from leftronic import Leftronic
import datetime

#Your Close.io & Leftronic API Credentials
closeio_key = 'YOUR_API_KEY'
update = Leftronic("YOUR_LEFTRONIC_ACCESS_KEY")

#Use the datetime library to retrieve the current day's report
today = datetime.date.today()
tomorrow = datetime.date.today() + datetime.timedelta(days=1)

#Today's activity report URL, using strings to always display the current day's report
today_report = 'https://app.close.io/api/v1/report/{YOUR_ORGANIZATION_ID}?user_id=all&date_start=%sT04:00:00.000Z&date_end=%sT06:59:59.999Z' % (today, tomorrow)

#JSON response from Close.io
response = requests.get(today_report, auth=(closeio_key, ''), headers={'Content-Type': 'application/json'})

#Retrieves the JSON response, and getting just the calls made
calls_today = response.json['calls']

#Pushes the number of calls to your Leftronic widget
update.pushNumber("LEFTRONIC_WIDGET_STREAM_NAME", calls_today)
To get the above code to work, you’ll need to reference the following:
- The Requests python library
- The Leftronic Python package
- Close.io API Docs
- Leftronic Python API Docs
- A "pushNumber" widget on a Leftronic dashboard
Close.io Reporting URLs
Close.io’s API documentation does a great job of describing how to format certain URLs to get the type of data you would like. Not only can you get a response on your activity or pipeline reports, but you can also retrieve a list of leads using search:
Sample URL For All New Active Opportunities In Last 7 Days:
#Always use URL encode formatting for any query
url = 'https://app.close.io/api/v1/lead/?query=opportunity_created%20%3C%20%227%20days%20ago%22%20opportunity_status%3Aactive'
Sample URL For An Individual User’s 7-Day Activity Report:
#See Close.io docs to get ORG_ID & USER_ID
url = 'https://app.close.io/api/v1/report/{YOUR_ORG_ID}/?type=activity&user_id={YOUR_SALES_USERS_ID}&date_start=%sT04:00:00.000Z&date_end=%sT06:59:59.999Z' % (sevendays, tomorrow)'
Pushing Close.io Data To Leftronic
Leftronic provides some great documentation on how to push your data to the appropriate widgets, but here is an example that includes some nuances with Close.io:
Pushing Won Revenue To A Sparkline
update.pushNumber("yourSparklineName", {"prefix": "$", "number": "%0.2f" % wonrevenue/100.0})
Close.io outputs all currency in cents, so you’ll need to divide by 100.0 and put the decimal point in the right place.
The most rewarding widgets for us are line graphs and sparklines. Since our data is being pushed every couple of minutes, Leftronic logs each time it receives new data and gives you a couple of options for which duration of time you’d like to display.
So if you are tracking week-over-week growth (if not, you should start), you can visualize the data over time by sending continuous updates to Leftronic and let the data pile up over time.
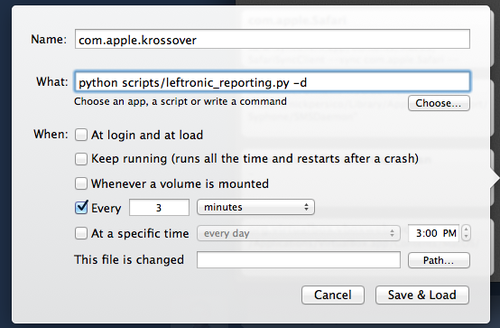
Updating The Dashboard Automatically
I welcome any better solutions, but I update all of my sales dashboards using a Mac app called Lingon 3. It allows me to automatically run the dashboard script every couple of minutes off my laptop in the form of a cron task:
Questions? Comments? Feedback?
Do you have sales dashboards? What are some KPI’s that your team tracks? I welcome any feedback/questions in the comments below or drop me an email.
See examples and code snippets we put together for sending Close.io data to Leftronic on Github.
Thanks to @philfreo and @wojcikstefan for their help!